Latest News News Archives

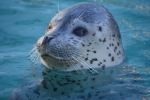
May 22, 2026First Harbor Seal Pup of the Season Admitted from Kenai, Alaska

January 30, 2026ASLC Provides Care in a Rare Ringed Seal Response Case

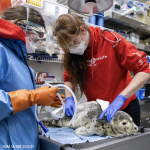
November 17, 2025Back-to-Back Rescues Bring Two Orphaned Sea Otter Pups to ASLC for Rehabilitation

October 21, 2025Uki the Walrus’s Rehabilitation Story Featured on PBS Nature Season Premiere
October 16, 2025Rare Rescue Patient: Spotted Seal Pup Gaining Strength at Alaska SeaLife Center
Events
Upcoming


Explore the Alaska SeaLife Center after hours at Beers by the Bay. Sample beer, wine, cider, mead, and kombucha more...

All are welcome at this fun, free community event! Get in the holiday spirit with cookie decorating, crafts, more...
Science Spotlight
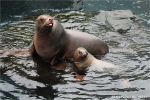
The period of maternal investment in Steller sea lions is the most energetically demanding, and is a critical period for adequate food intake in... Learn More
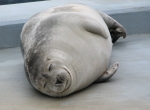
The PHOCAS—Physiology and Health of Cooperating Arctic Seals—program is a collaborative research effort between Long Marine Laboratory at the... Learn More
Overview:
This remote monitoring study is the longest ongoing research project at the Alaska SeaLife Center (ASLC). Since 1998, scientists at... Learn More
Harbor seal (Phoca vitalina) abundance in the Aleutian Island chain of Alaska has experienced a greater than 60% decline over the last twenty... Learn More
Overview
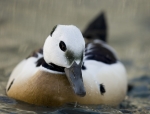
The limited knowledge that we have about walrus diet in Bristol Bay comes from Traditional Ecological Knowledge of local residents.... Learn More
What We Hope To Learn:

What We Hope To Learn:
What We Hope To Learn:
What We Hope to Learn:
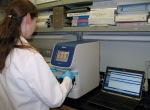
Recently advanced biochemical tracking methods involve the analysis of dietary biomarkers (i.e. fatty acid signature... Learn More
Overview
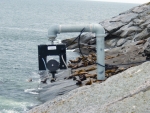
Pollution and climate change are affecting environments worldwide and methods are needed to monitor their impacts on coastal... Learn More